The BX Score quantifies a farm’s sustainability on a scale from 0 to 1000, taking into account both historical and current management practices and their outcomes.
![]()
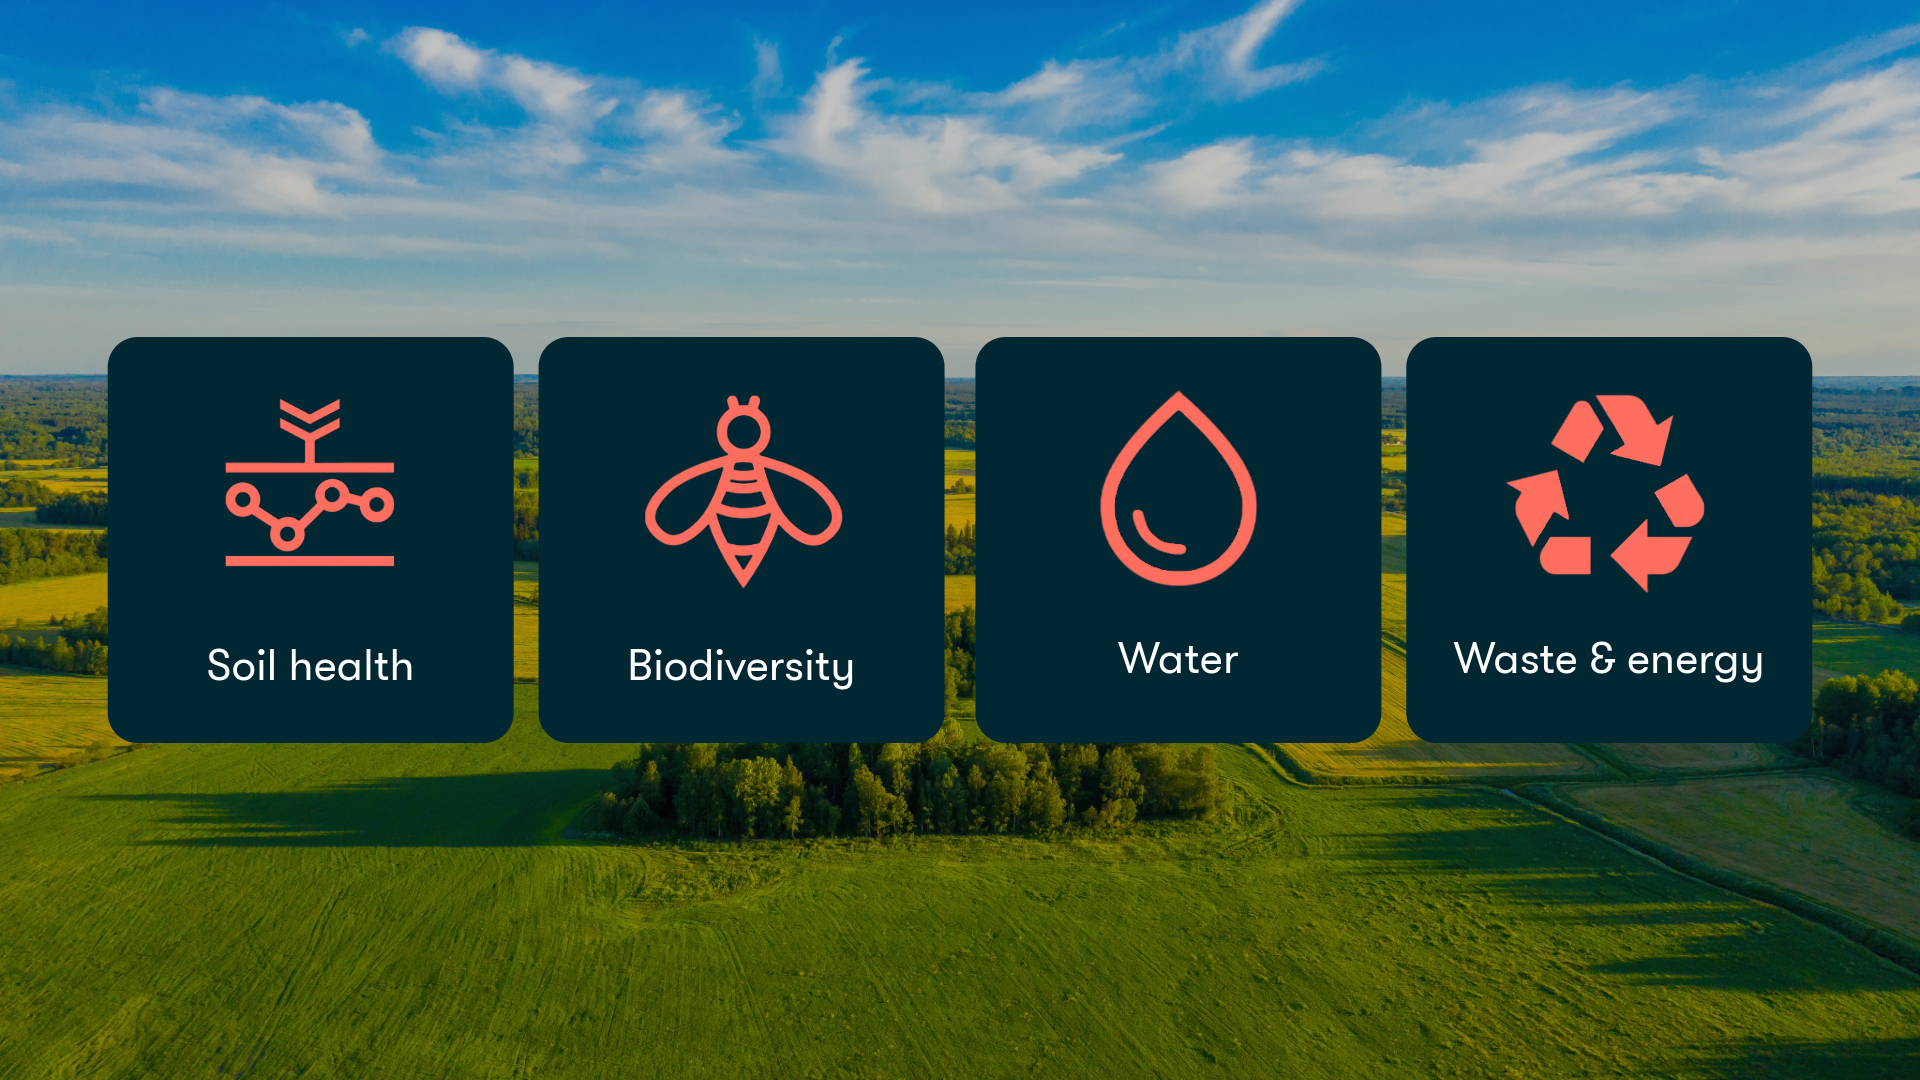
The score is separated into the domains of water, soil, energy, waste, and biodiversity.
Key Performance Indicators
Outcome-Based Measurement
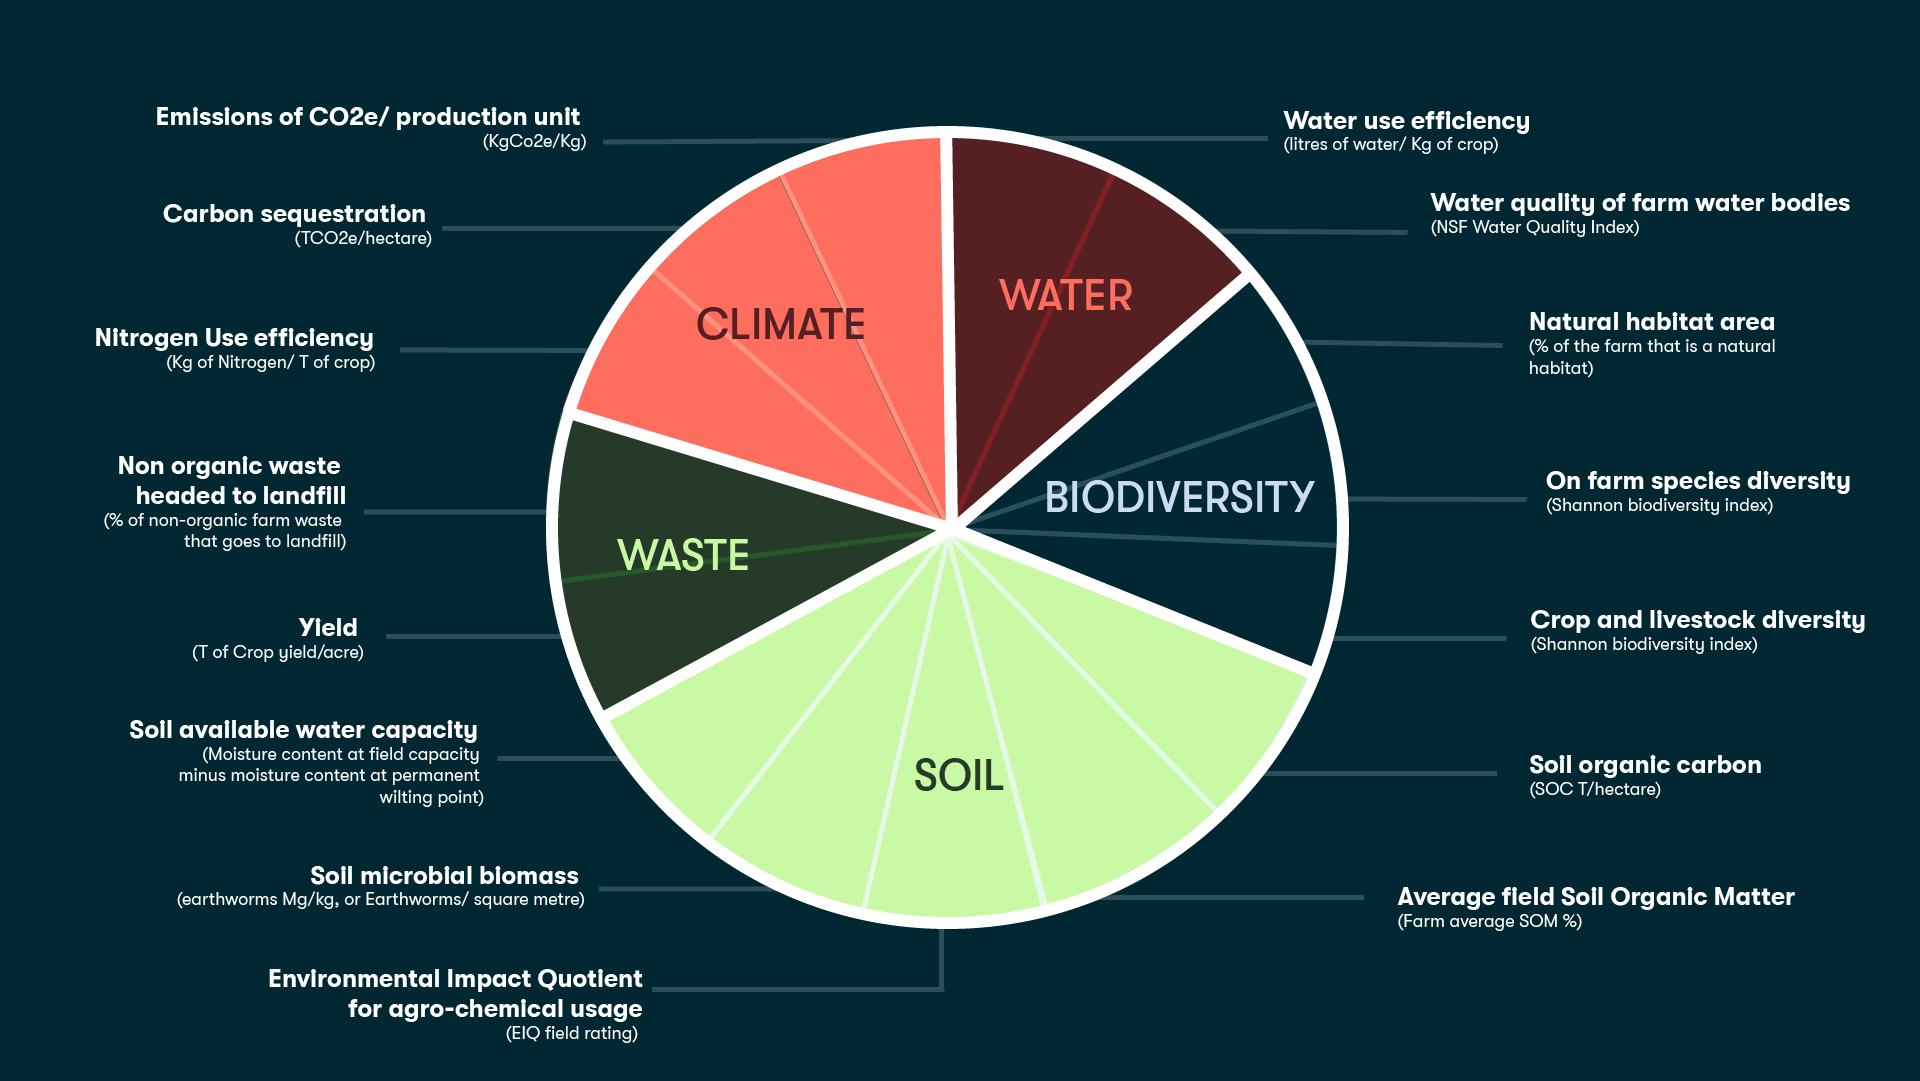
500 points derive from direct outcomes of farming practices across the five domains. We align these with existing sustainability frameworks to streamline reporting processes. Each domain features specific benchmarks tailored to your farm’s geographic and ecological context, totalling 15 measurable indicators.
Task Items – Tailored Agronomic advice
Another 500 points can be earned through regenerative tasks.
Not sure where to start? BX Improve provides tailored agronomic advice to guide you in choosing management practices or infrastructure changes that enhance farm sustainability.
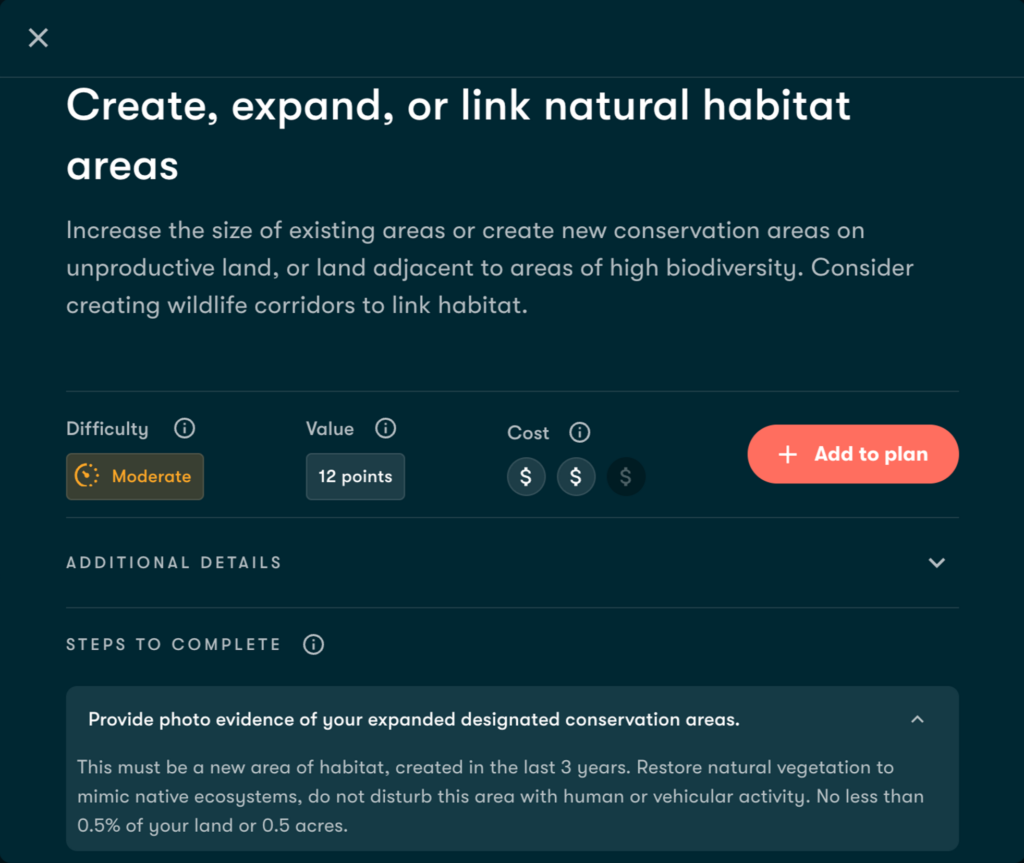
We offer detailed steps for implementing sustainable practices, such as choosing and managing cover crops. Each recommended task comes with:
- An associated estimated cost
- Difficulty rating
- References to scientific literature, enabling you to make informed decisions based on the latest research.
Tasks are organised by the domains mentioned earlier (energy, waste, biodiversity, soil, and water). Task requirements range from sharing soil sample results to creating riparian buffer zones. At the heart of every task requirement is data. Without some evidence, we can’t award BX points. We try to make this process as hassle-free as possible so that it’s not just another a cumbersome annual tickbox process. Simply share whichever PDFs or relevant documents you have and we’ll take care of the rest. The BX Improve section has been designed to facilitate your uptake of “regenerative” tasks and cost-effectively build your score.
Understanding Your Score: What Does a Good Score Look Like?
Your score is a dynamic measure of sustainability across key domains such as water, climate, waste, biodiversity, and soil health. As you improve practices and as we deepen our understanding of your farm, your score will evolve, offering you a way to gauge your progress and compare it with peers in your region.
Continuous Improvement is Key
Each farm is unique, with its own set of challenges and opportunities. It’s important to focus on continuous improvement, rather than aiming for a static “perfect” score. Sustainability is a journey—successful farms are those that continuously adapt and enhance their practices.
What to Expect Year by Year
As you progress, here’s an idea of what each score range signifies and how you might see your efforts reflected over time:
Beginners: 0 – 250 points
Intermediate: 250 -500 points
Experienced farmers: > 500 points